Our Top Picks

Perfect for curious kids ready to explore why things cost what they do! This AC/DC kit introduces real-world electronics, helping children understand the tangible value behind products and how scarcit

A genuine treasure trove that demonstrates supply and demand in action! With 256 crayons and markers, your child will experience firsthand how having abundant supplies feels different from scarcity—a

Over 200 craft items teach kids about resource management and choice. When children have limited supplies, they learn to prioritize and understand why certain materials become more 'valuable' when har

A wonderful starter set for young artists to explore color and creativity. As your child discovers their favorite colors, you can naturally discuss why some shades might be harder to find—a gentle int
Your child asks why ice cream costs more in summer, or wonders why everyone suddenly wants the same toy right before the holidays. These aren't random questions—they're glimpses into economic thinking. Supply and demand might sound like a topic for high school economics class, but the truth is, kids encounter these concepts every single day in the real world around them.
The magic happens when you help them connect the dots. Imagine watching your child's face light up when they realize that scarcity makes things valuable, or when they understand why their favorite store might raise prices when everyone's shopping at once. These "aha!" moments stick with them because they're based on real experiences they can see and touch.
The toys and games on this page are designed to make those lightbulb moments happen naturally—through play, strategy, and hands-on discovery. Whether it's running a virtual market stand, negotiating trades, or strategizing their way through a board game, children absorb economic principles without ever feeling like they're "learning a lesson." That's the sweet spot where learning becomes genuine curiosity.
Age Recommendations
Ages 3-5: Start with observation and simple language. Talk about 'lots' and 'all gone' while playing with toys and art supplies. When your child's favorite crayon runs out, ask, 'What should we do now?' This plants the seed that availability matters.
Ages 6-8: Your child is ready for real-world connections! Discuss why certain toys are harder to find during holidays or why ice cream costs more in summer. Use craft and building projects to show how having fewer supplies makes them feel more valuable. Ask guiding questions rather than giving answers.
Ages 9+: Introduce more sophisticated concepts using hands-on projects and current events. Electronics kits and complex craft sets naturally spark discussions about pricing, design choices, and why people want certain products. Encourage them to think like inventors and business owners.
Our Recommended Products

Exciting Gender Reveal Party Supplies!
American Greetings Gender Reveal Party Supplies is the perfect way to bring joy and anticipation to your celebration! This vibrant 7-piece banner kit not only creates a festive atmosphere but also encourages kids to engage in discussions about family and friendships. As they help decorate, children develop fine motor skills and creativity, making it a fun educational experience. With a design that features both pink and blue elements, it adds a delightful touch to any gender reveal party and sparks joy for everyone involved.
Exciting Gender Reveal Party Supplies includes a vibrant 7-piece banner kit that transforms decorating into a fun, collaborative art project while building bonds and skills.

Crayola Art Supplies Bundle for Young Creators
The Crayola Young Kids Art Supplies Bundle is the perfect gateway for budding artists! Designed for children 36 months and older, this set not only sparks creativity but also fosters essential skills like fine motor development and color recognition. With 8 Tripod Grip Crayons and Markers, little hands can explore vibrant colors while mastering their grip and coordination. Paired with a fun activity book that guides them in practicing letters and numbers, this bundle is a wonderful choice for parents looking to combine artistry with early learning.
Crayola Art Supplies Bundle for Young Creators includes 8 Tripod Grip Crayons and Markers, making it perfect for enhancing grip and fostering artistic expression at an early age.

Ampersand Art Supply Hardboard for Creative Minds
Ampersand Art Supply Hardboard Wood Painting Panel is your new best friend in the art world! This museum-quality surface not only provides excellent support for your aspiring artists but also introduces them to a variety of mediums, fostering creativity and skill development. As parents and educators, we know how crucial it is to offer our children stable surfaces that allow freedom of expression without the worry of damage. Watch them explore their artistic abilities while building confidence and fine motor skills with this versatile and durable painting panel!
Ampersand Art Supply Hardboard offers museum-quality support for young artists to unleash their creativity, turning every brushstroke into a boost of confidence.

Power Up Learning with AC/DC Kit!
Elenco AC/DC Triple Output Power Supply Kit is a fantastic way to introduce students to the fascinating world of electronics. This hands-on kit fosters critical thinking and engineering skills as kids build a power supply that delivers precise DC voltage. Perfect for school labs, it encourages experimentation and deeper understanding of electrical concepts. Plus, with over 30 years of trusted design from Elenco, you know you’re giving your young learners a reliable and exciting educational tool!
Power Up Learning with AC/DC Kit! is a hands-on kit that empowers kids to build a precise DC voltage power supply, igniting their passion for electronics in an engaging way.

Unicorn Party Plates for Magical Moments
American Greetings Unicorn Party Supplies, Paper Dessert Plates are a delightful addition to any child's celebration! These charming plates, adorned with festive cupcakes and colorful sprinkles, are perfect for fostering creativity and imagination during snack time. By incorporating themed supplies into our parties, we encourage kids to express their unique personalities and enjoy interactive experiences with friends. Plus, with 40 plates in a convenient pack, we're fully equipped for all our exciting gatherings while adding a whimsical touch to the festivities!
Unicorn Party Plates come in a convenient pack of 40, inspiring kids to add a sprinkle of magic to their snack time while unleashing their creativity with friends.

Elenco Quad Power: Empowering Young Engineers
Elenco Quad Power Solid-state DC Power Supply is the ultimate companion for budding inventors and engineers! With four fully regulated power supplies, children can explore the world of electronics with confidence and precision. This versatile tool not only fosters critical thinking and problem-solving skills, but also ignites creativity as they design and test their own projects. Made in the USA and backed by over 30 years of engineering expertise, Elenco provides an exciting educational experience that every parent and educator can trust.
Elenco Quad Power features four regulated power supplies, sparking creativity in young engineers as they experiment and build their own electronic projects with confidence.

Crayola Tote Pencil Box Joy!
The Tin Box Company Crayola Tote Pencil Box with Handle is a delightful way to keep school supplies organized and ready for creativity! With vibrant Crayola graphics, this sturdy box encourages children to take ownership of their learning tools—from crayons to scissors and everything in between. It’s not just a practical storage solution; it sparks imagination and responsibility as kids learn to manage their own supplies. Perfect for art projects, homework, or playtime, this pencil box is a great investment in your child’s educational journey!
Crayola Tote Pencil Box Joy! features vibrant graphics that make organizing school supplies feel like an adventure, turning learning tools into treasures your child will want to care for.

Creative Adventures with Crayola Classpack
Crayola Crayons and Washable Markers Classpack is the ultimate treasure trove for our little artists! With 256 ultra-clean, washable crayons and markers at their fingertips, kids can explore their imagination without the worry of making a mess. This bulk supply not only supports vibrant creativity but also encourages essential skills like fine motor development and color recognition. Perfect for classrooms or home art stations, these nontoxic and safe art supplies are designed for fun and learning, making them an invaluable addition to any educational setting!
Creative Adventures with Crayola Classpack includes 256 ultra-clean, washable crayons and markers, allowing little artists to unleash their imagination without the mess—just pure creativity!

Ultimate Rainbow Crafting Adventure
The Made By Me! Ultimate Jar of Crafts is the perfect creative companion for kids ages 6 and up, and even adults! Packed with over 200 essential craft supplies, this kit inspires imagination, fine motor skills, and artistic expression through hands-on engagement. Whether we’re stringing colorful beads for a bracelet or using fuzzy pom poms to bring our ideas to life, every craft becomes a delightful learning experience that enriches our creativity and problem-solving skills. Plus, the reusable storage jar ensures our crafting supplies are always organized and ready for on-the-go fun!
Ultimate Rainbow Crafting Adventure is packed with over 200 essential craft supplies, turning every project into a vibrant exploration of imagination and hands-on learning.

Empower Learning with American Girl Truly Me Doll
American Girl Truly Me 18-inch Doll 27 & School Day to Soccer Play Playset with Supplies, Uniform, and Ball is such an enchanting way for our kids to engage in imaginative play while developing essential school and sports skills. With her adorable outfit and a backpack packed with learning supplies like a pretend tablet loaded with lessons from bees to biology, this doll invites children to explore different subjects creatively. Not only does she encourage educational exploration, but the after-school soccer set also promotes physical activity, teamwork, and coordination. As parents, we can appreciate how much this playset enriches our children's learning experiences!
Empower Learning with American Girl Truly Me Doll includes a pretend tablet packed with lessons, making learning feel like play while inspiring kids to explore both academics and sports.

Crayola's Creative Drafting Delight
The Crayola Art Supplies Drafting Tool is a wonderful introduction to the world of design for young artists. This innovative tool helps children develop essential skills like spatial awareness, creativity, and fine motor coordination as they explore their artistic abilities. Designed for budding creators, this drafting tool encourages imaginative play and lays the groundwork for lifelong artistic pursuits.
Crayola's Creative Drafting Delight introduces kids to design with tools that spark imagination, making art feel like a thrilling adventure into their own creativity.
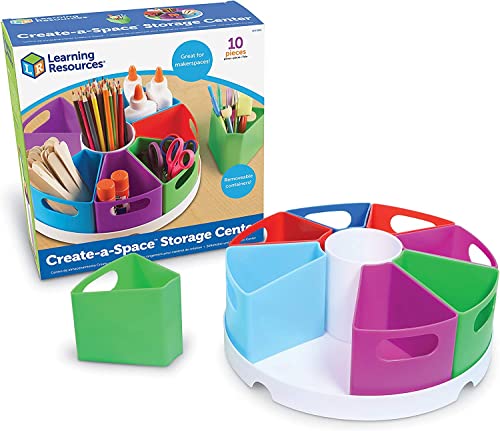
Creative Space Storage Center
The Learning Resources Create a Space Storage Center is an essential organization tool that turns clutter into creativity for young learners. With its 9 removable compartments, this toy desk organizer not only keeps art supplies at their fingertips but also teaches kids important skills like organization, sharing, and responsibility. Perfect for classrooms, homeschooling, or crafting at home, it encourages independence and teamwork while making clean-up a breeze!
Creative Space Storage Center features 9 removable compartments that transform chaos into a tidy crafting oasis, making clean-up a cooperative and fun adventure for everyone.

Crayola Classpack: Creative Learning Fun
The Crayola Colored Pencils Classpack (240ct) is an essential classroom supply that encourages creativity and artistic expression in students. With a wide range of vibrant colors, this bulk set fosters color recognition, fine motor skills, and collaboration during group projects, helping educators create a vibrant, engaging learning environment. It's a fantastic option for teachers who want to ensure every student can explore their imagination without limits!
Crayola Classpack includes 240 vibrant colored pencils, making it a dream come true for classrooms where imagination knows no bounds and every project bursts with color.

Schleich Horse Club Care Set
The Schleich Horse Club 6-Piece Horse Toys Accessory set is perfect for young equine enthusiasts aged 5 and up. This engaging playset encourages imaginative play, nurturing skills, and an understanding of animal care as children interact with realistic miniatures, such as grooming supplies and oats. It's a delightful way for kids to explore a future in veterinary science while developing empathy and responsibility towards animals.
Schleich Horse Club Care Set includes realistic miniatures that spark a child’s creativity while teaching them the essential skills of caring for animals.

Paw Patrol Fun Learning Desk
The PAW Patrol Draw and Play Desk by Delta Children inspires creativity and learning for little artists aged 2 and up. This vibrant desk not only engages your child with their favorite characters but also nurtures fine motor skills and hand-eye coordination through coloring and drawing activities. With plenty of storage for supplies, it emphasizes organization and responsibility, making it a perfect addition to any child's learning environment.
Paw Patrol Fun Learning Desk features storage for supplies, making cleanup a breeze while inspiring little artists to express themselves through colorful creativity.

Vibrant Cra-Z-Art Crayons for Creativity
The Cra-Z-Art 16ct Crayons are a fantastic tool for young artists aged 3 and up! These bold, vibrant colors encourage creative expression and help develop fine motor skills and hand-eye coordination through drawing and coloring activities. Non-toxic and designed for smooth application, they are not just a school supply; they’re a source of joy and imagination that can brighten any project.
Vibrant Cra-Z-Art Crayons for Creativity feature bold, vibrant colors that inspire young artists to explore their imaginations while developing essential fine motor skills—art has never been this fun!

Play-Doh Creative Color Explosion
The Play-Doh Ultimate Color Collection 65-Pack brings a vibrant spectrum of 60 different colors right into your child's hands. This engaging modeling compound enhances fine motor skills, encourages creativity, and fosters imaginative play as kids shape and mold their dreams into reality. Perfect for art activities, classroom supplies, or party favors, this fun assortment encourages collaboration and social skills as friends come together to share in the joy of creation.
Play-Doh Creative Color Explosion includes 60 vibrant colors that turn imaginative play into a fun way for kids to express themselves while enhancing essential skills.

Gold for Creative Minds
The Crayola Crayons Gold, Single Color Crayon Refill, 12 Count is a fantastic tool for unleashing creativity in children and sparking their imagination. Ideal for classroom activities or personal projects, these vibrant gold crayons help develop fine motor skills, color recognition, and artistic self-expression. Parents and educators will appreciate how these classic art supplies not only make learning fun but also encourage kids to explore their artistic talents with endless possibilities.
Gold for Creative Minds includes 12 vibrant crayons that turn ordinary doodles into masterpieces, sparking endless opportunities for imaginative play and artistic exploration.

Eureka Cinnamon Stickers - Scents of Learning
Eureka Cinnamon Stickers bring a delightful twist to traditional classroom supplies! These scented stickers aren't just fun; they engage students' senses and spark creativity. Ideal for rewarding hard work or enhancing arts and crafts, they can also aid in developing fine motor skills as little hands peel and stick. As fellow parents and educators, we cherish tools that turn learning into an enjoyable experience—these stickers do just that!
Eureka Cinnamon Stickers feature delightful scents that make rewarding hard work feel like a celebration, and they sneak in fine motor practice during arts and crafts too!

Creative Cra-Z-Art School Bundle
The Cra-Z-Art Markers, Crayons, Colored Pencil Back To School Bundle is an essential toolkit for K-2nd graders eager to explore their creativity. This comprehensive set not only ignites artistic expression but also enhances fine motor skills, color recognition, and cognitive development as children engage in vibrant drawing and coloring activities. With rich colors and smooth application, these supplies make learning fun while fostering important skills for early education.
Creative Cra-Z-Art School Bundle includes a variety of rich colors that inspire artistic expression, making learning an exciting, hands-on adventure for young creators.

Creative Colors for Young Artists
Colorations Construction Paper for Kids is an essential art supply for budding creators, providing 600 sheets in vibrant hues that ignite imagination. This heavyweight craft paper not only encourages artistic expression but also promotes fine motor skills and color recognition, making it a perfect addition to both home and classroom activities. As parents and educators, we appreciate its durability, enabling kids to explore their creativity without worrying about tearing or cracking the paper.
Creative Colors for Young Artists provides 600 sheets of heavyweight craft paper that invites little hands to explore their artistic flair without the worry of tears.

Creative Classroom Crayola Collection
The Crayola Colored Pencil Classpack (462ct) is an essential resource for teachers and creative families alike. With 14 vibrant colors and 12 handy sharpeners, this set not only fuels artistic expression but also enhances dexterity, color recognition, and collaborative skills as students and kids engage in group projects or personal art endeavors. It's an inviting way to inspire creativity and connect learning with fun, making it a top choice for quality school supplies.
Creative Classroom Crayola Collection includes 462 vibrant colored pencils that transform art time into a social event, making creativity a blast for everyone involved.

Llama Party Invitations Make Learning Fun!
Creative Converting Llama Party Invitations are the perfect way to kick off your child's fiesta! These delightful fold-out invitations not only set the mood for fun but also encourage kids to practice their writing skills as they fill in all the details. With a charming llama theme, they inspire creativity and excitement about celebrating with friends. Plus, they coordinate beautifully with other llama-themed party supplies, making everything come together seamlessly!
Llama Party Invitations make learning fun with delightful fold-out design that encourages kids to practice their writing as they eagerly prepare for their festive celebrations.

Shimmering Fun with Crayola Metallic Markers
Crayola Metallic Markers are the perfect addition to our art supplies! With eight dazzling colors, these markers can transform ordinary homework assignments into vibrant masterpieces. We love how they encourage creativity in kids while helping them develop fine motor skills and artistic expression. Plus, they’re safe and non-toxic, making them ideal for young artists aged 3 and up. Pair these metallic wonders with Crayola Glitter Markers for a truly magical effect!
Shimmering Fun with Crayola Metallic Markers includes eight dazzling colors that turn ordinary assignments into vibrant art projects, encouraging kids to unleash their creativity with every stroke.

Colorful Dinosaur Stickers for Creative Play
Fun Express Colorful Dinosaur Paper Stickers are the perfect way to spark creativity in your child! With a delightful array of dinosaurs like T-Rex and Stegosaurus, these stickers encourage imaginative play and storytelling. Ideal for enhancing fine motor skills as kids peel and stick, they also inspire artistic expression through crafting and scrapbooking. Whether decorating their room or personalizing school supplies, these vibrant stickers offer endless opportunities for learning and fun!
Colorful Dinosaur Stickers for Creative Play offer a delightful variety of dinosaur designs, turning sticker time into an inventive storytelling adventure that fosters creativity and fine motor skills.
Educational Value
When children engage in imaginative commerce—setting up a play market, managing resources in a strategy game, or negotiating trades—they're building real economic reasoning. They learn that value isn't fixed; it changes based on what people want and what's available. A board game like Monopoly or Anti-Monopoly teaches decision-making under pressure, resource allocation, and the consequences of choices. Play money helps younger children understand that currency is a tool for exchange, not just pieces of paper.
But beyond the mechanics, these activities spark conversations. Your child asks questions, you help them think through cause and effect, and suddenly supply and demand isn't abstract—it's something they understand because they've experienced it. That's how deep learning happens: through curiosity, play, and real-world connections.